Handwritten Sound-Propagation Calculation
 Next Image
What This Image Shows
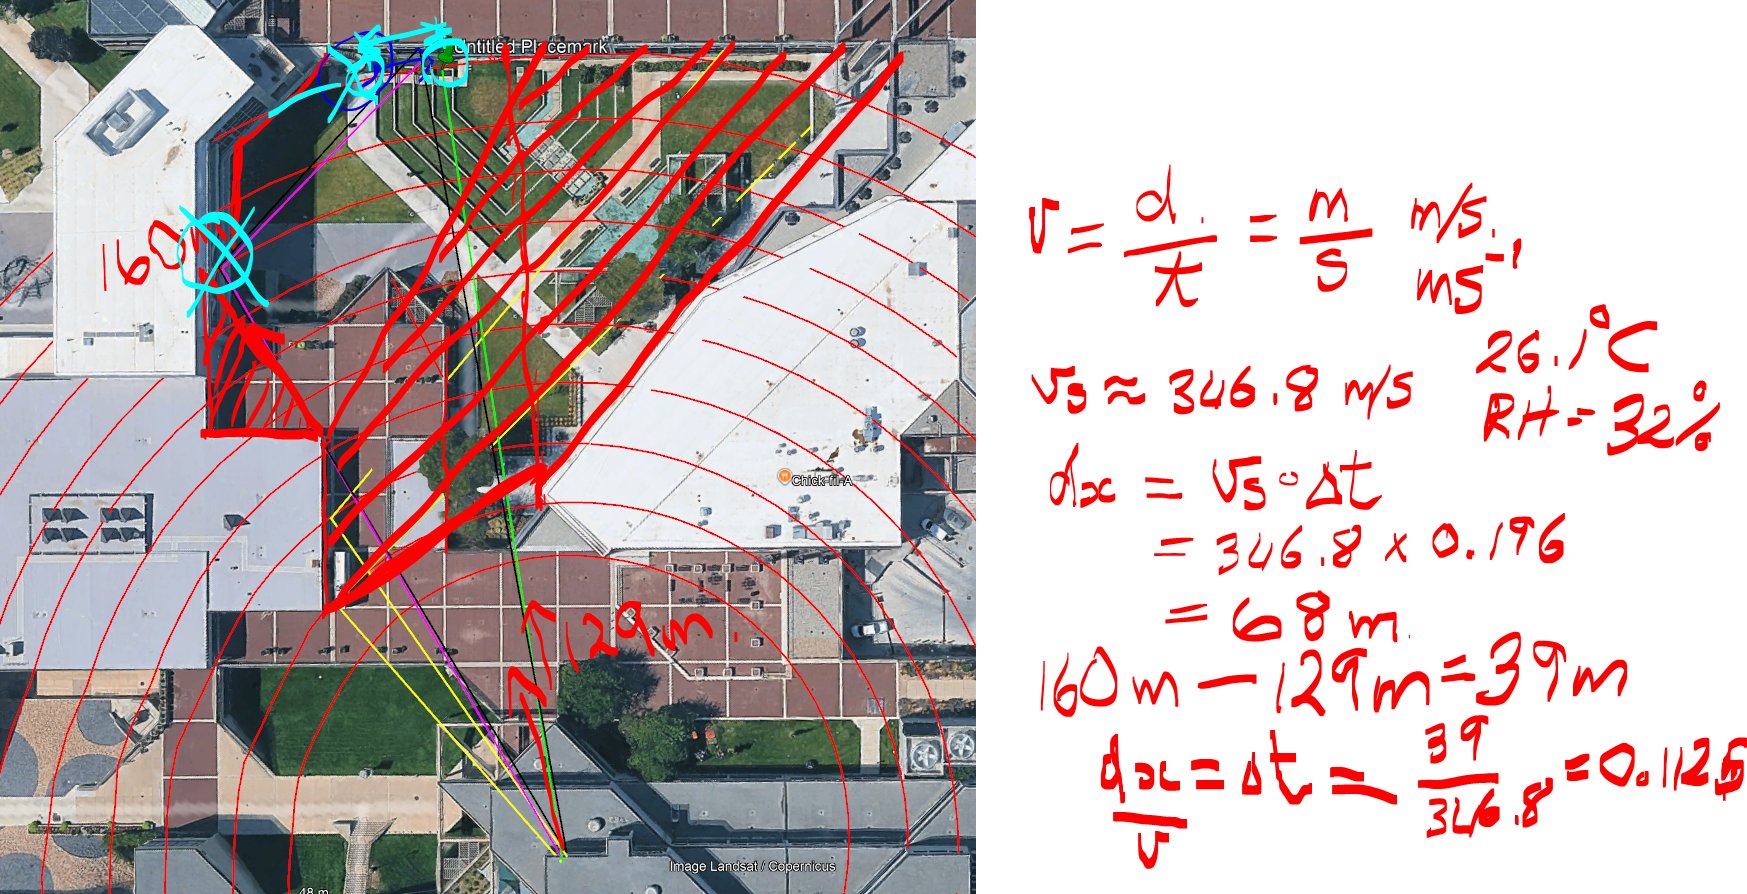
A split composite: an annotated satellite map of the plaza on the left, overlaid with geometric lines and concentric wave-propagation arcs, and handwritten calculations in red digital ink on white at the right.
The working is legible and checkable. The analyst sets the speed of sound at 346.8 metres per second for conditions of 26.1 degrees Celsius and 32 percent relative humidity, then computes a distance from a measured time offset — 346.8 multiplied by 0.196 seconds giving 68 metres — and separately subtracts two mapped distances, 160 metres minus about 121 metres, to get a 39-metre difference, which divided by the speed of sound yields a predicted arrival gap of about 0.1125 seconds. The map carries a Chick-fil-A marker and an untitled placemark, with the Landsat and Copernicus imagery credit at the bottom.
This is the most transparent piece of acoustic reasoning in the cluster, because every input is written down and can be checked: the temperature, the humidity, the mapped distances, and the measured offset. That also makes it the easiest to falsify — if any mapped distance is wrong, the conclusion moves. Read it against the other acoustic material at Acoustic Two-Event Split and the Acoustics Expert sub-cluster.
This website's author is @HolonCitizen on X and YouTube/@HolonCitizen. Follow me there.
Where This Image Appears
This image is used on the following investigation pages:
Related Areas
- Cluster: Ballistics and the Gun
- Section: Gun & Bullet Analysis
- All photos: Photos