← Unfiled Backlog
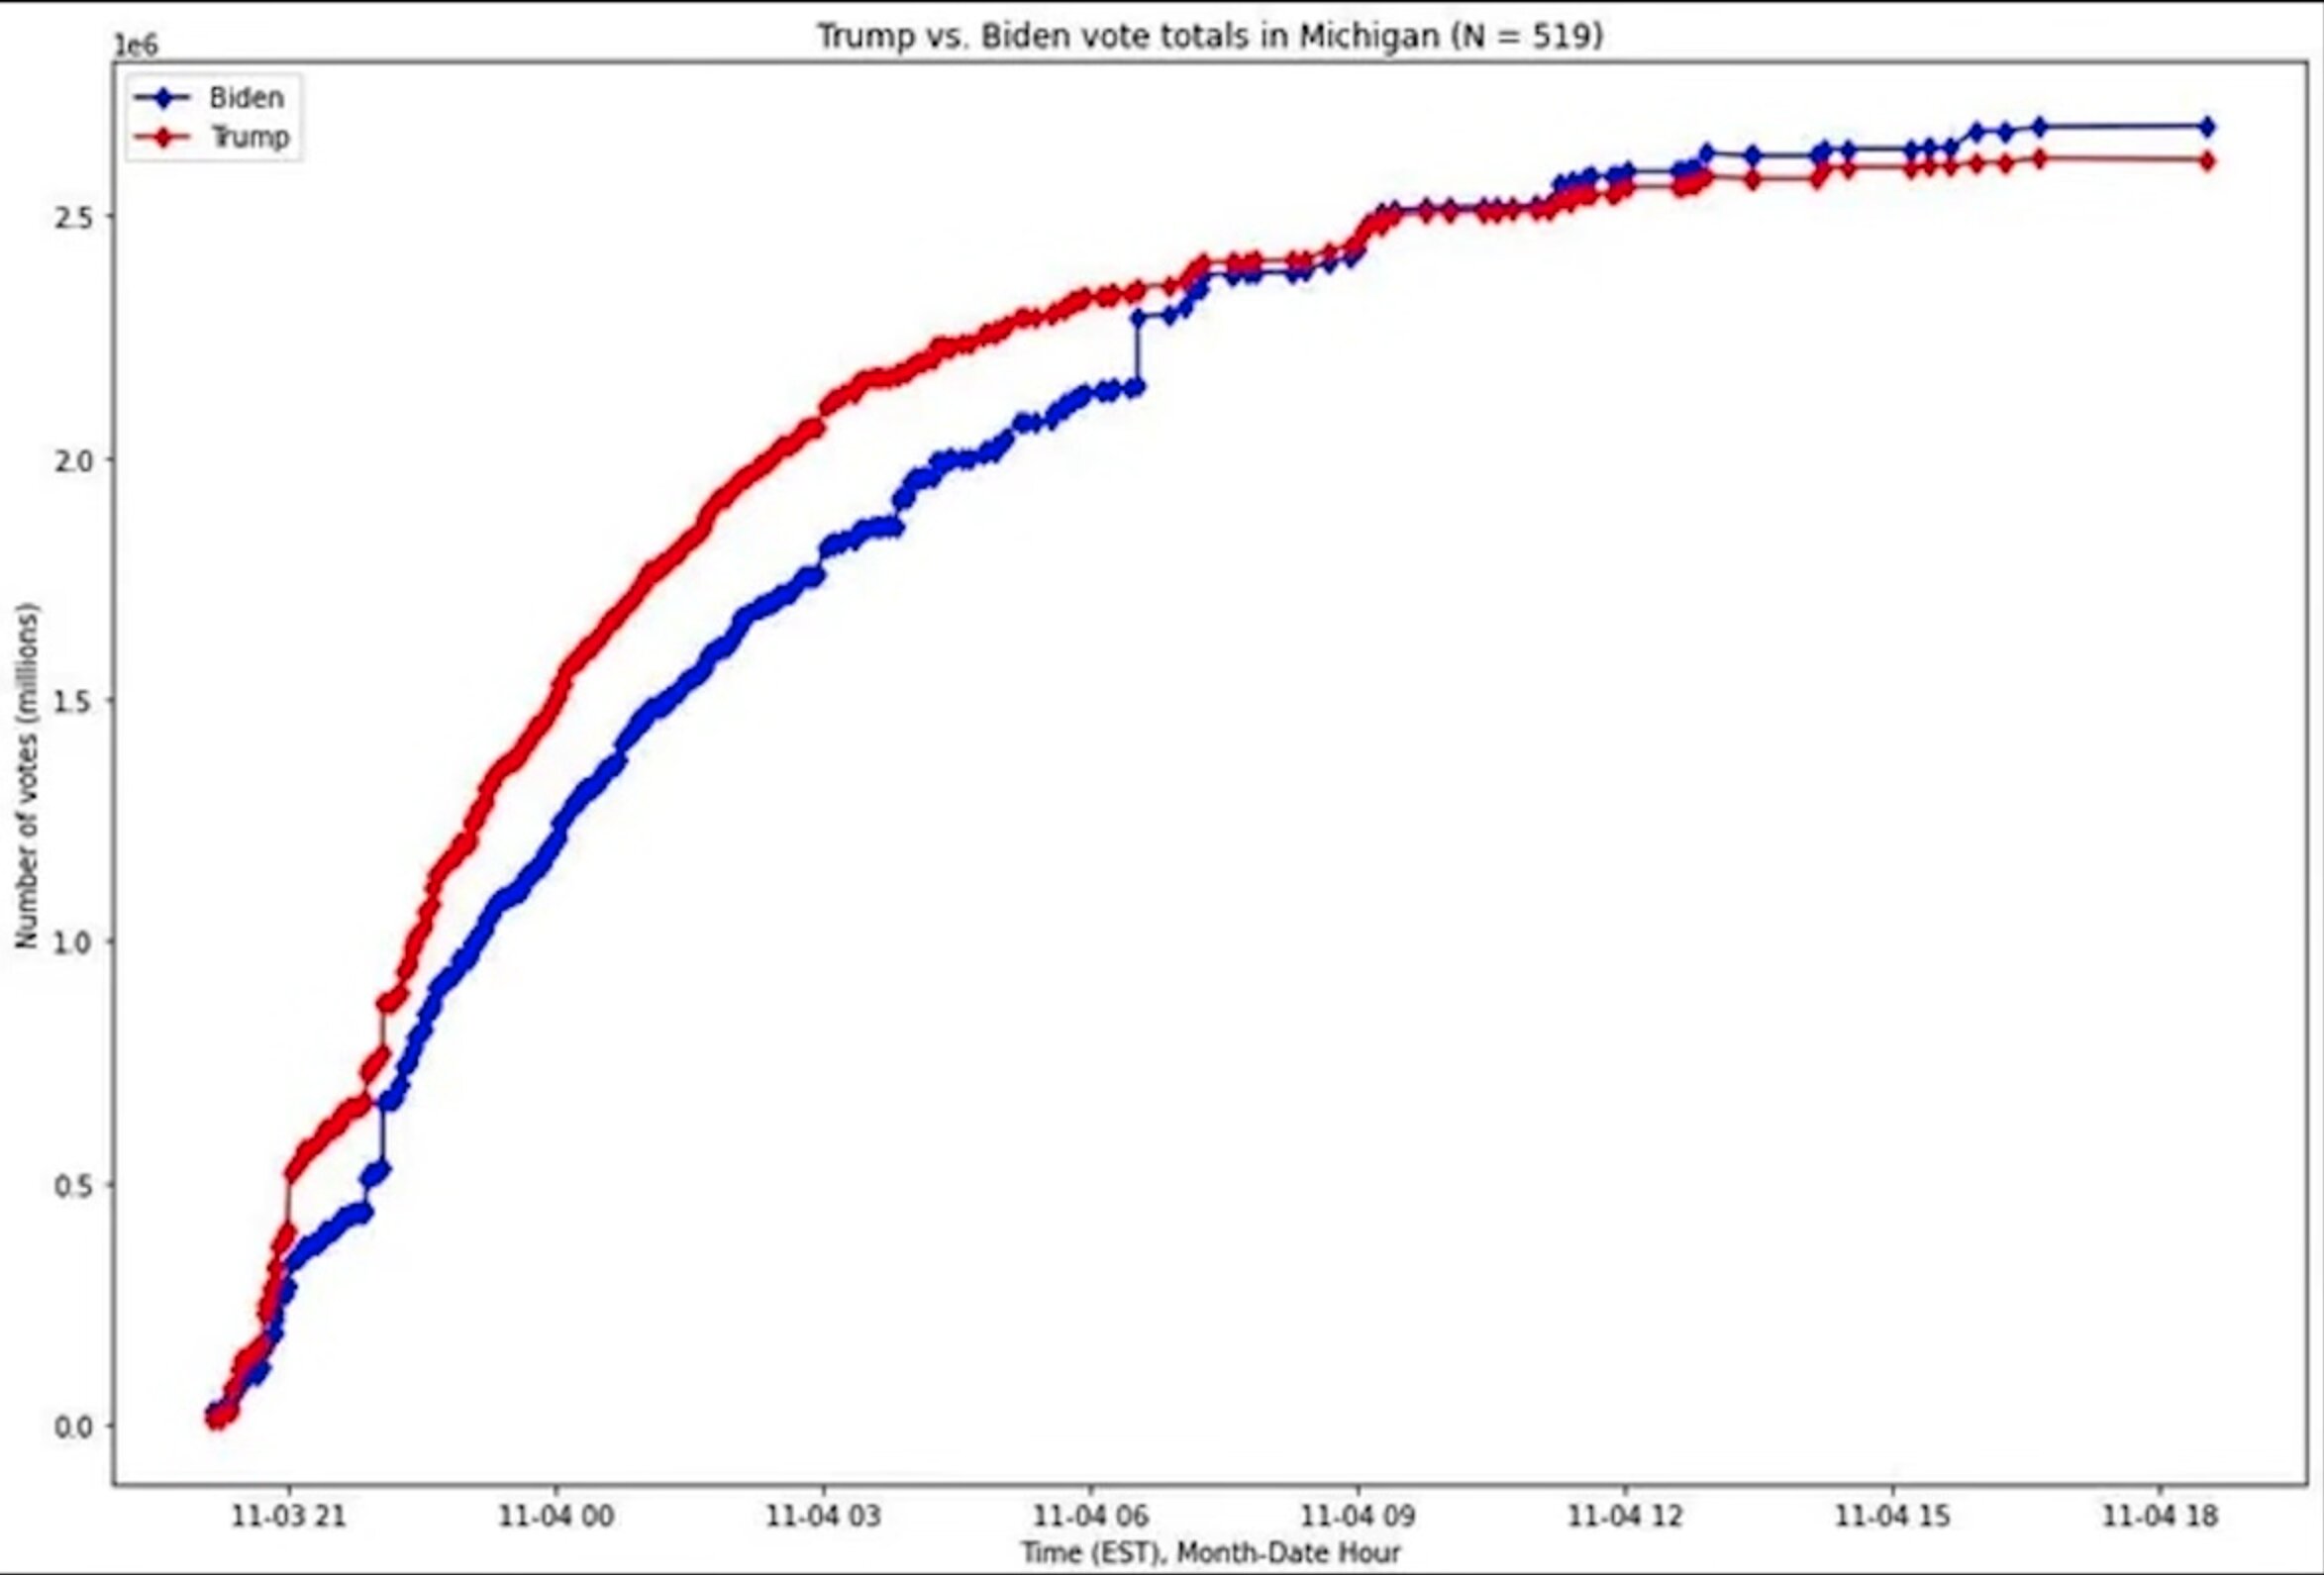
Michigan Cumulative Vote Chart
What This Image Shows
A line chart headed "Trump vs. Biden vote totals in Michigan (N = 519)," plotting two cumulative vote curves against a time axis labelled from 11-03 21:00 through 11-04 18:00 EST, with the vertical axis reading "Number of votes (millions)." One curve shows a near-vertical step early on November 4.
There is no other on-screen text.
This is election material rather than case material. Vertical steps in cumulative count charts are the expected shape when a large batch of results is reported at once, which is how absentee counts were released in several states in 2020; the chart shows reporting behaviour rather than establishing anything about the votes themselves. It is recorded here without adoption. See Vote.
Related Areas
- Cluster: Unfiled Backlog
- All photo evidence: Photos